contributor: 조남경님
-
OpenAI API를 사용해 대량의 이미지를 생산했습니다.
-
그러나 너무나 많은 이미지를 찍어낸 나머지 기법 이름과 매치해서 보기가 어렵습니다.
-
python-pptx를 이용해 효과적으로 정리합니다. DeepL의 자동 번역도 빌립니다.
-
이번 글은 코드 비중이 큽니다. 보시기 어려울 것 같아 최종결과 다운로드 링크를 먼저 드립니다.
-
분량이 많아 통판과 함께 4개로 나눈 버전을 함께 올립니다.
DALL.E3 스타일 가이드북 part I 다운로드
DALL.E3 스타일 가이드북 part II 다운로드
DALL.E3 스타일 가이드북 part III 다운로드
DALL.E3 스타일 가이드북 part IV 다운로드
- 활용시 출처를 명기해주시기 바랍니다.
- 무단 도용을 막기 위한 워터마크가 삽입되어 있습니다.
- 워터마크가 없는 버전을 원하시는 분께서는 개별 연락바랍니다. (jehyun.lee@gmail.com)
4. OpenAI API: 추가 Image Generation
4.1. 빠진 스타일 추가
- 지난 글에서 챗달이(ChatGPT + DALL.E)가 제공하는 다양한 스타일을 확인했습니다.
- 이 다양한 스타일을 최대한 자동으로 정리하고자 ChatGPT의 도움을 받았지만,
- 막상 챗달이에서 그림을 그려보려면 여전히 없는 스타일들이 있습니다.
mute tone,sepia같은 그림의 톤은 이번 탐구의 대상이 아니니 넘어간다 치더라도,- 중요 스타일들은 빠진 것이 너무 불편해서 손으로 챗달이 화면을 넘기며 이름을 추가했습니다.
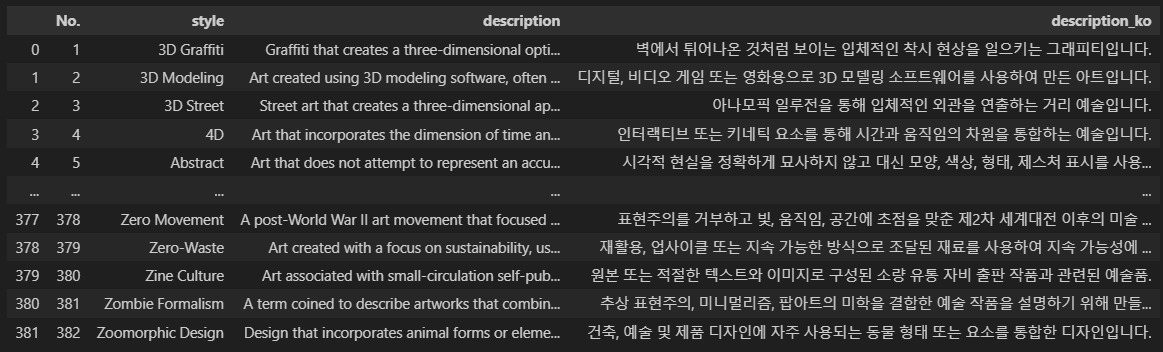
comic book,folk art,silk screen,acrylic,charcoal,hand-drawn,pencil sketch,cave art,linocut,carravaggism,cartoon,pastel,retro,ink wask,ink painting,woodcut,alcohol ink,claymation,sci-fi,felt,crayon,mosaic가 그 대상입니다.- 결과적으로 총 382종의 스타일을 확보했고, ChatGPT의 힘을 빌려 description과 그림을 얻었습니다.
4.2. 샘플 그림 추가
- 커피를 소재로 여러 스타일을 적용했으나 답답함이 느껴졌습니다.
- 커피잔은 정적인 대상이기 때문에 스타일 반영에 제약이 있을 것이라 생각해서 다른 대상을 여럿 추가했습니다.
- 사물인 커피잔에 동물, 식물, 소년, 소녀, 건축물, 풍경을 추가합니다.
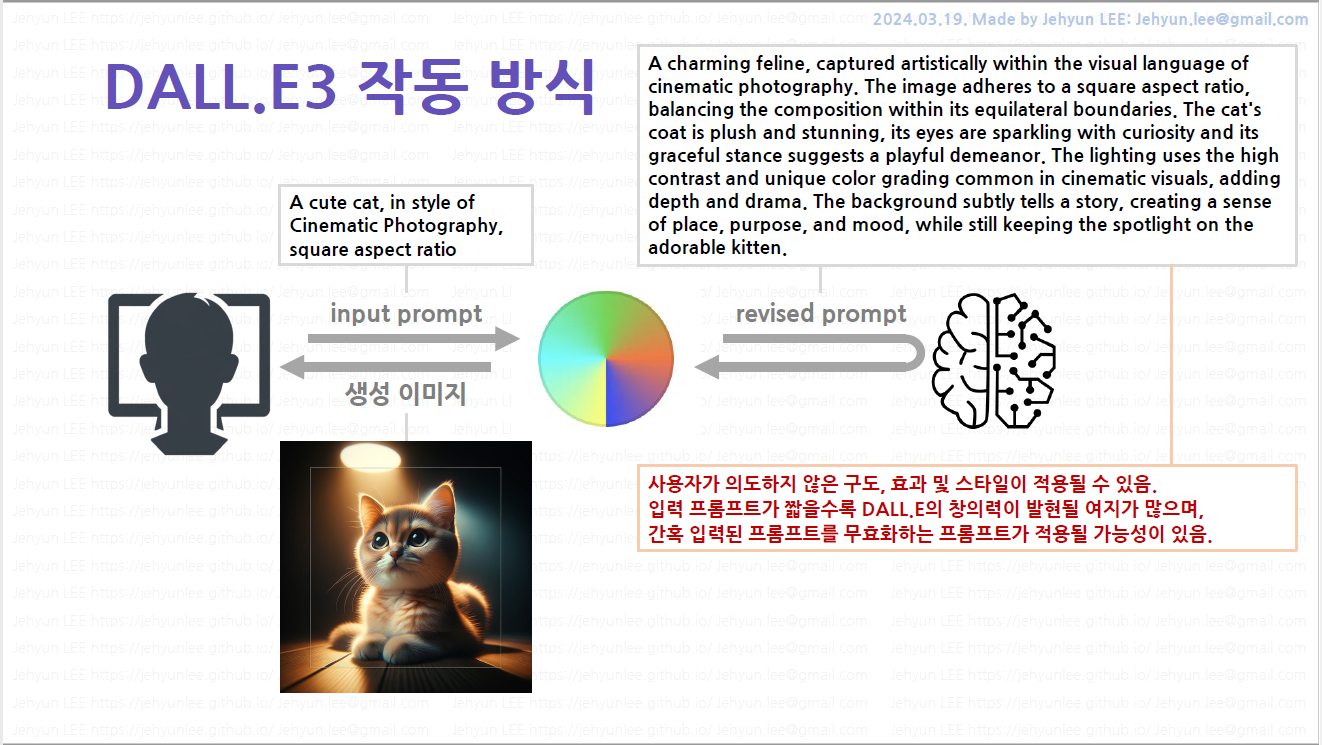
- 대상이 스타일에 따라 구도가 바뀔 수도 있을 것 같아 프롬프트는 최소한으로 입력했습니다.
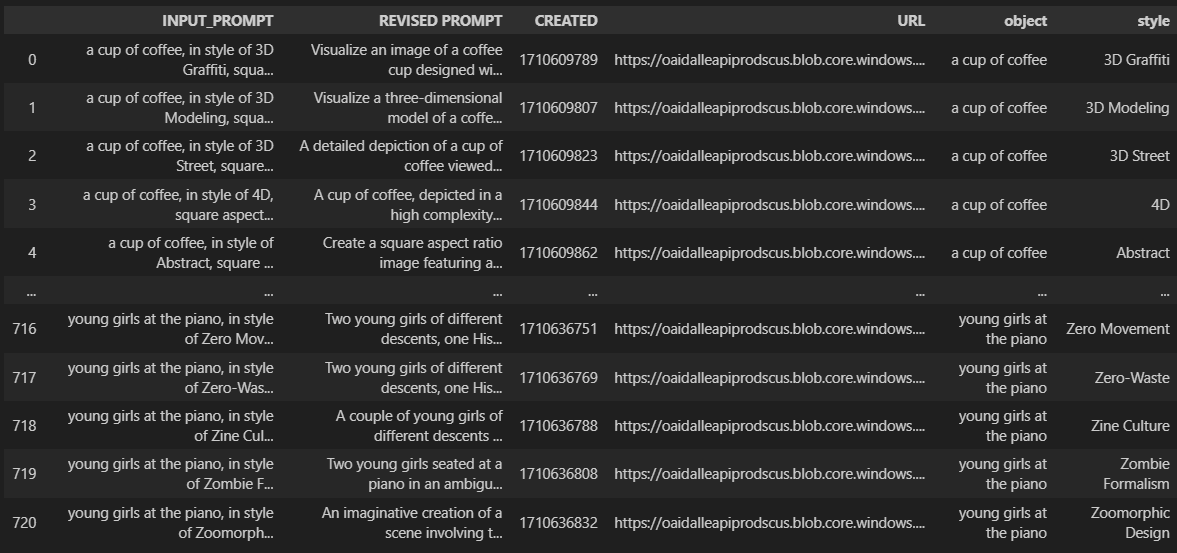
{object}, in style of {style}, square aspect ratio.
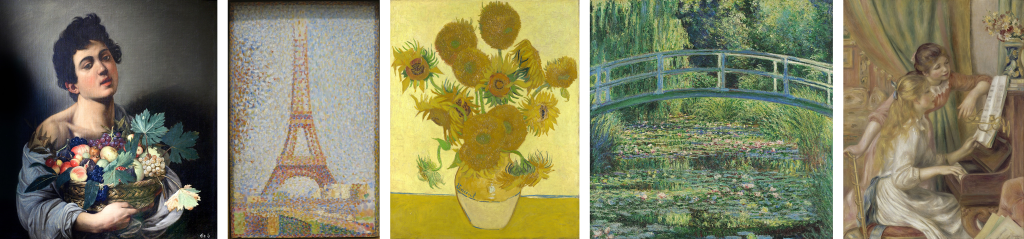
- 여러 명화에서 소재를 가져와 추가했습니다.
- 실제 그림과 그림 제목을 프롬프트로 사용했을 때 얼마나 유사한지 비교해보고 싶기도 했습니다.
a cup of coffee,a cute cat: 조남경著, 미드저니 프롬프트 가이드
boy with a basket of fruit: 카라바조 (1593), Caravaggism
eiffel tower: 조르주 쇠라 (1889), pointillism
sunflowers: 반 고흐 (1888), Post Impressionism
water-lily pond: 클로드 모네 (1919), Impressionism
Young Girls at the Piano: 오귀스트 르누아르 (1892) Impressionism
- 일부 샘플 결과를 비교해 보니 소재를 추가한 보람이 있습니다.
- 여러 소재에서 스타일의 특색이 잘 느껴집니다.
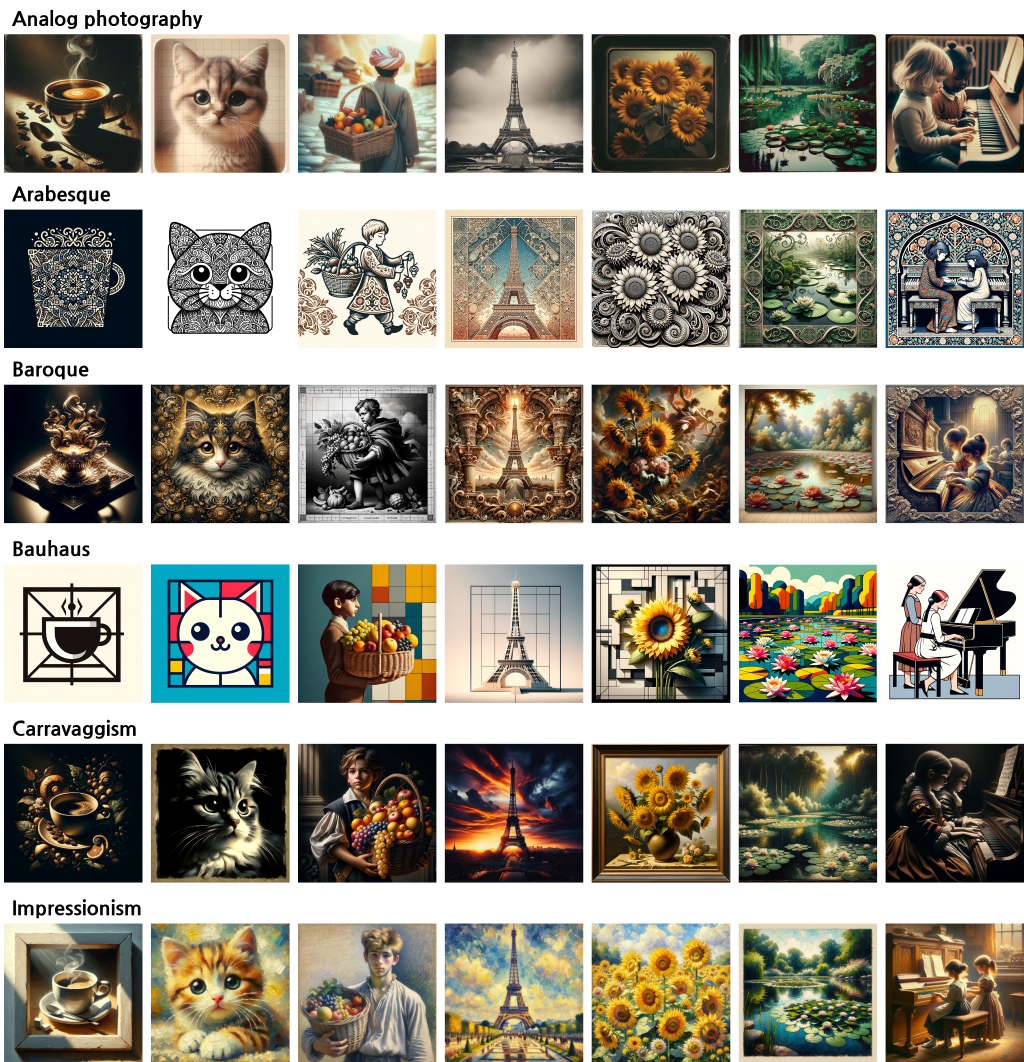
- 그런데 생각보다 달리의 자유도가 많이 반영된 것 같습니다.
- 짧은 프롬프트가 입력되면 비어 있는 공간을 달리의 상상력으로 채우기 때문입니다.
- 챗달이가 만든 revised prompt를 저장해 두었으니 어떻게 상상했는지 알아볼 수 있습니다.
- 이렇게 382종 x 7가지 대상 = 2,674장의 그림이 마련되었습니다.
- 그림 하나에 1초씩만 쓰며 넘겨도 45분이 걸리는 분량입니다.
- 한번에 보고 머리에 넣기는 도저히 무리입니다.
- 두고 종종 볼 수 있도록 예쁘게 정리합시다.
5. 자료 정리
5.1. Microsoft Powerpoint
- 함께 담을 정보가 제법 많습니다.
- 항목만 꼽아도 스타일 이름, 스타일 설명, 그림 7장이 있고, 제법 긴 revised prompt도 참고차 함께 정리해야 합니다.
- 스타일 설명은 한국어로 번역도 해야 할 것 같습니다.
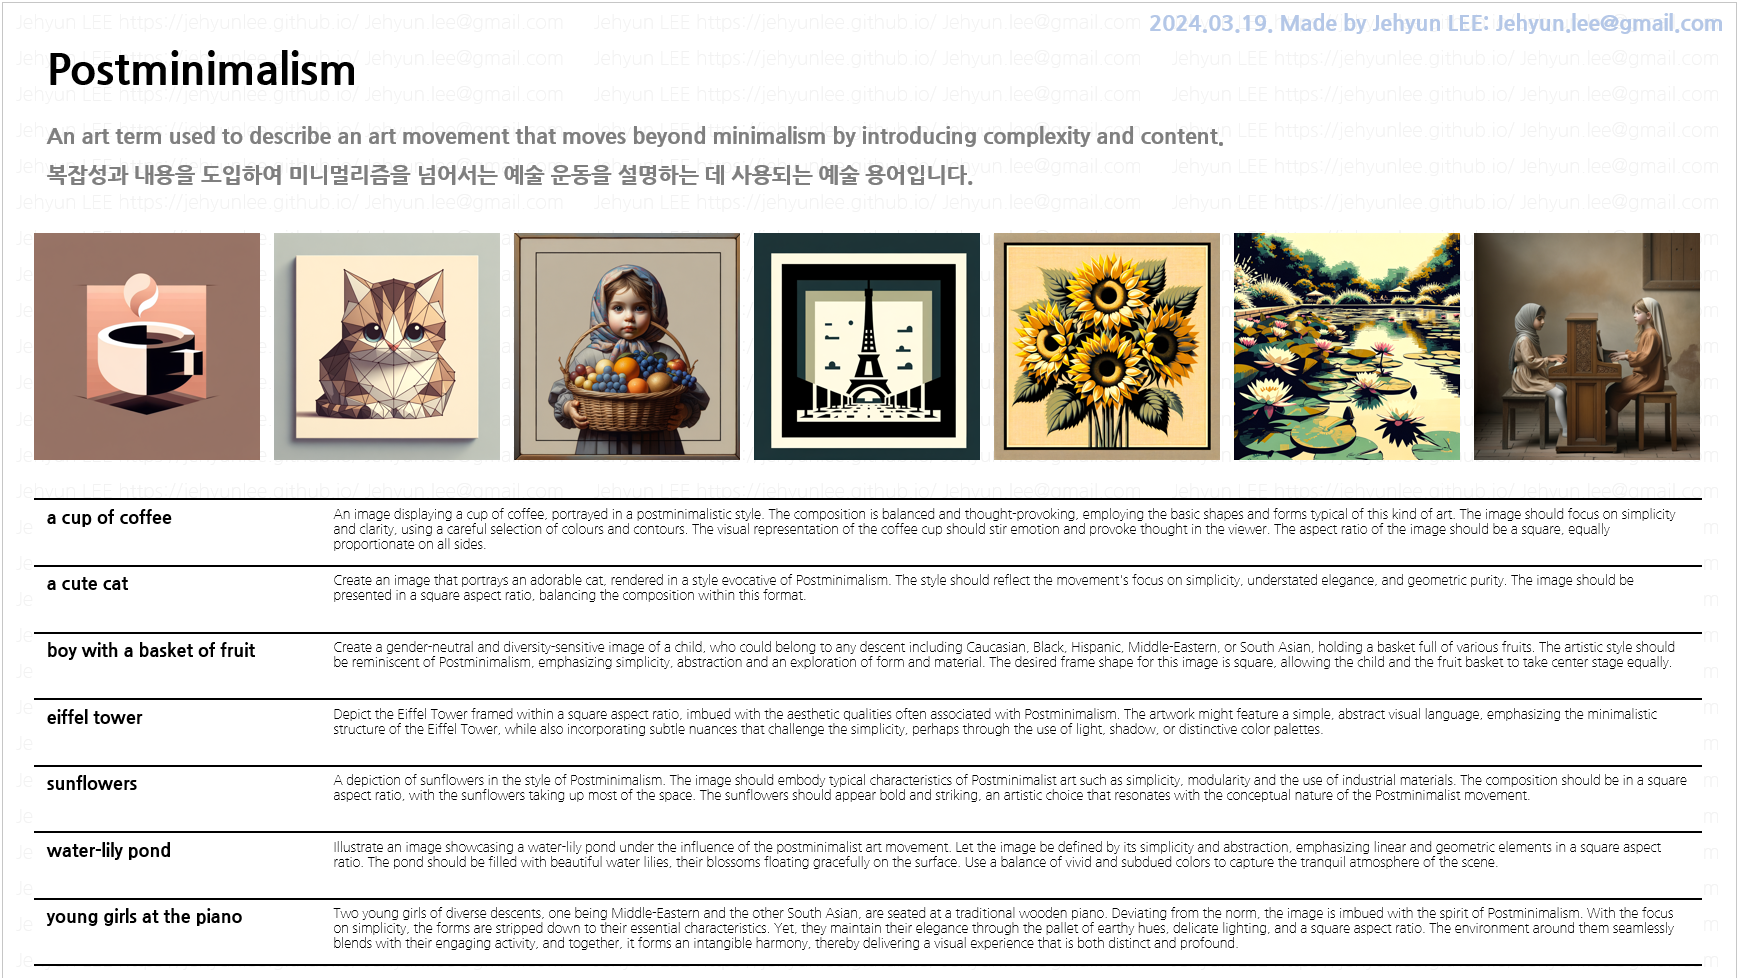
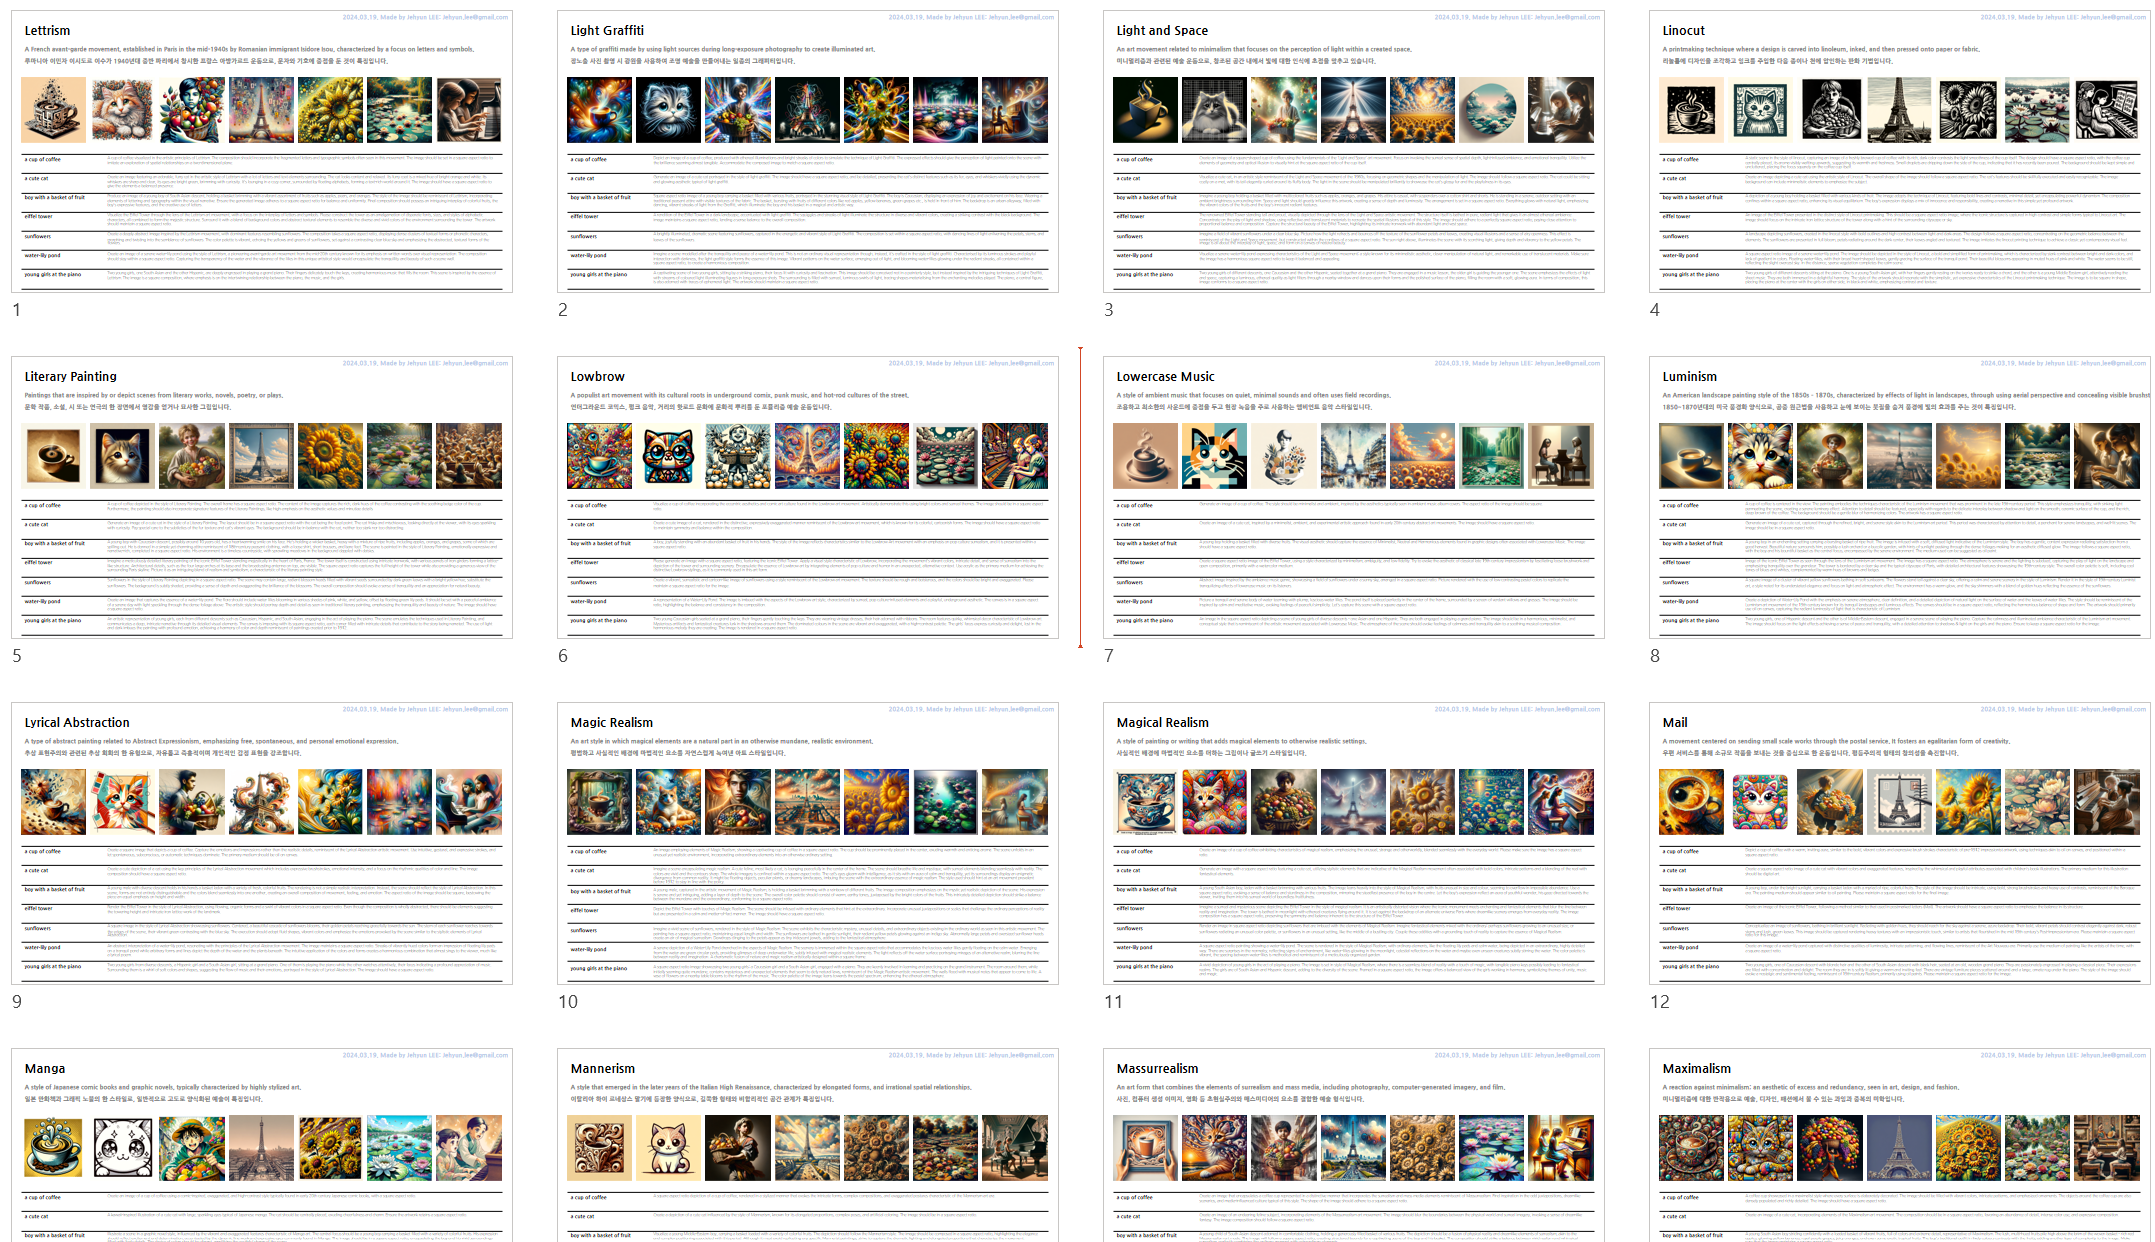
- 고민 끝에 파워포인트에서 스타일별로 다음과 같은 페이지를 구성하기로 했습니다.
- 마우스를 클릭하고 드래그하며 한 장을 어찌어찌 만들기는 했는데 시간이 제법 많이 갔습니다.
- 382장을 만들려니 아득합니다.
- 하지만 우리에게는 파이썬과 python-pptx 라이브러리가 있습니다.
- 자동화를 해버립니다.
5.2. DeepL API
- 먼저, 가독성을 높이기 위해 스타일 설명을 한글로 실어야 합니다.
- 영문으로 되어 있는 description을 번역합니다.
- 다행히 제법 좋은 번역기, DeepL API의 힘을 빌릴 수 있습니다.
- DeepL API 문서를 따라 예제를 만들어 실행합니다.
- 다음과 같이 영어가 불어로 번역됩니다. 속도도 제법 빠릅니다.
1 | import deepl |
- 실행 결과
1 | EN # 입력 언어 감지: 영어 |
- 모아둔 style description에 위 코드를 적용합니다.
pandas Series에apply()를 적용하면 다음과 같이 깔끔한 번역을 얻을 수 있습니다.
- 이제 파워포인트 슬라이드 작성을 자동화할 차례입니다.
5.3. 데이터 정리
- 먼저, 데이터를 깔끔하게 정리합시다.
pandas DataFrame을 사용해 input prompt에서 object와 style을 분리해둡니다.- 생성한 그림들이 object별 개별 폴더에 들어있고, 파일명에 style이 포함되어 있기 때문에 이미지 확보에 필요합니다.
- 또, 이렇게 분리한 object와 style은 revised prompt를 불러내는 key가 됩니다.
- 데이터 정리는 이 블로그의 다른 글에서 많이 했고, 어렵지 않으므로 생략합니다.
- 파워포인트 슬라이드 제작에 집중하겠습니다.
5.4. 파워포인트 슬라이드 제작
5.4.1. 새 슬라이드 만들기
- python-pptx는 파워포인트에서 마우스로 클릭하고 키보드를 입력하여 진행하는 모든 일을 코드로 수행합니다.
- 예를 들면 파워포인트에서 도형을 집어 옮기는 일은 간단하면서 두리뭉술하지만,
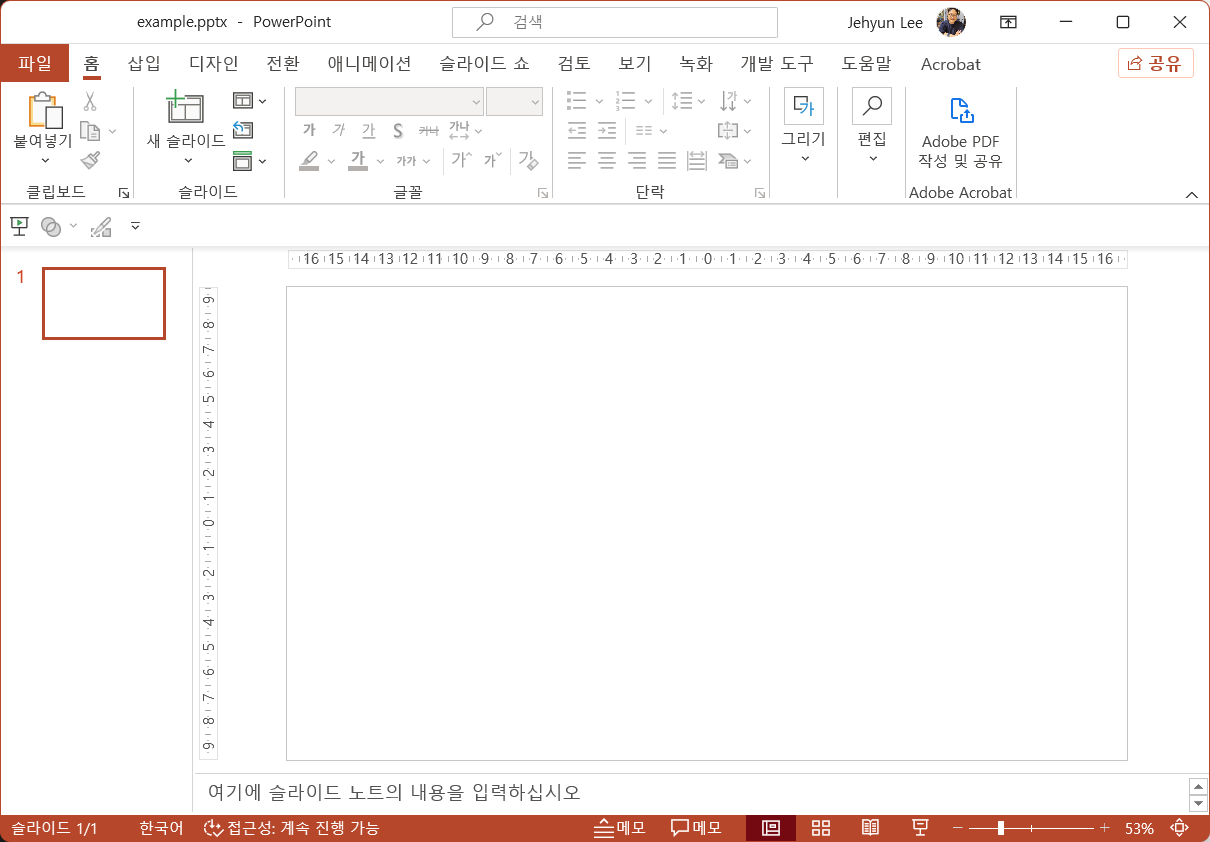
- 먼저, 새 프레젠테이션 파일과 슬라이드를 만드는 것으로 시작합니다.
1 | from pptx import Presentation |
- 위 코드를 실행하면 새 프레젠테이션이 만들어집니다.
- python-ppt에서는 도형이 놓일 지점의 좌표를 입력해야 합니다. 단위는 cm로 지정했습니다.
- 공식 예제에서는 Inch를 사용하지만 우리는 cm를 주로 쓰기 때문입니다.
- 손으로 만든 파워포인트 슬라이드에서 위치를 읽어 참조하기에 cm가 좋습니다.
- 이제 새 슬라이드에 텍스트 상자를 얹어 글을 쓰고 폰트와 색을 고를 차례입니다.
5.4.2. 텍스트 상자 만들기
-
앞서 손으로 만든 슬라이드에서 대부분의 객체가 텍스트 상자입니다.
-
텍스트 상자는 위치(가로, 세로), 크기(가로, 세로), 글꼴, 글꼴 크기, 글꼴 색 등 다양한 속성이 필요합니다.
-
텍스트 상자를 만들때마다 이 모든 속성을 지정해가며 만들기보다는 함수를 만드는 것이 합리적입니다.
-
색을 처리하는 함수를 먼저 만듭니다.
-
모든 도형에 색을 지정하는 과정이 수반되기 때문에 이 역시 함수를 만드는 것이 좋습니다.
-
입력 형식(
list,tuple,string)이 무엇이건 0~255 사이의 정수를 반환하는 함수를 만듭니다.
1 | # 입력 색 처리 (list, tuple, string) |
- 텍스트 상자 입력 함수를 만듭니다.
- 글꼴 이름은 파워포인트에서 보이는 이름 그대로 사용할 수 있어 편리합니다.
1 | from pptx.util import Pt |
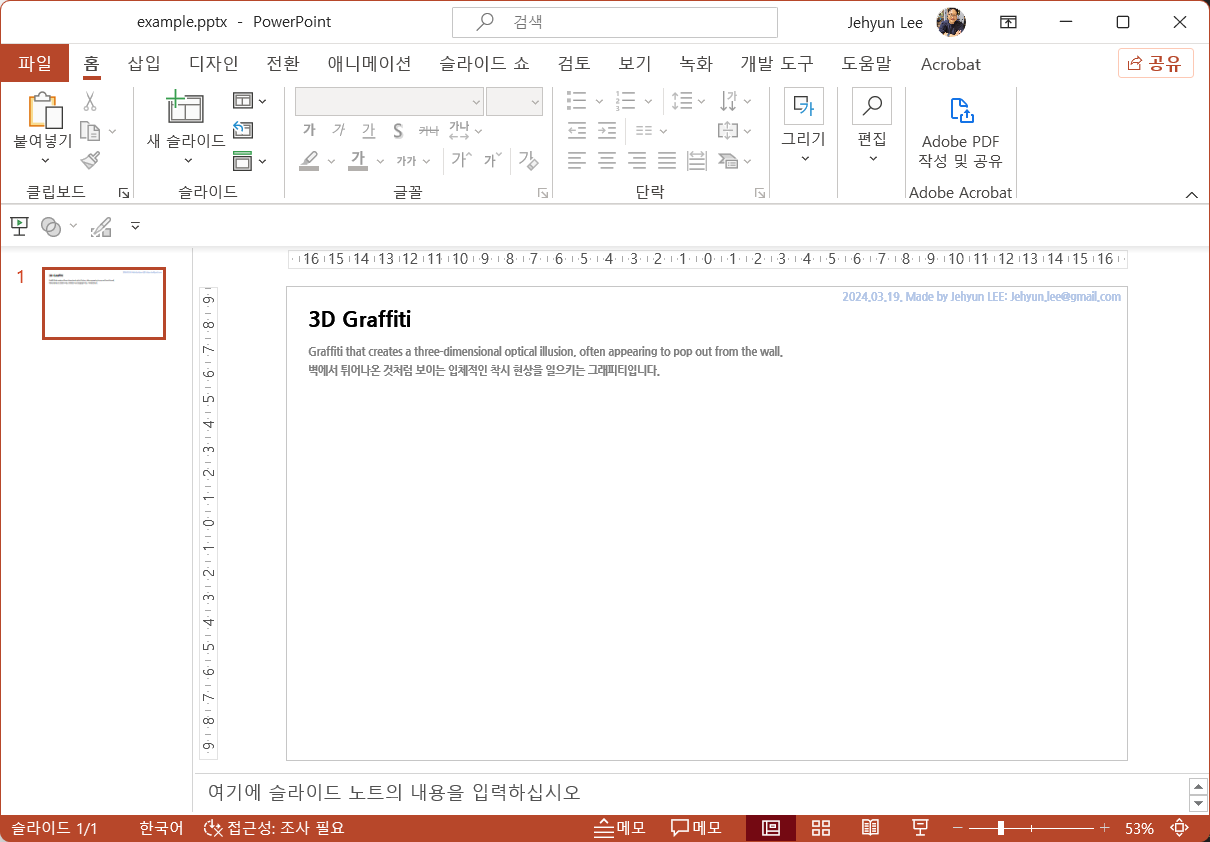
- 이 함수를 사용해 슬라이드에 텍스트를 추가합니다. 예제 style은 3D Graffiti로 설정했습니다.
- 우측 상단에 저작권 관련 문구를 하늘색으로 입력하고,
- 좌측 상단에 style 이름을 나눔고딕 ExtraBold를 사용해 입력합니다.
- 그 아래 style 설명을 영문과 국문으로 회색의 조금 작은 글씨로 입력합니다.
1 | style = "3D Graffiti" |
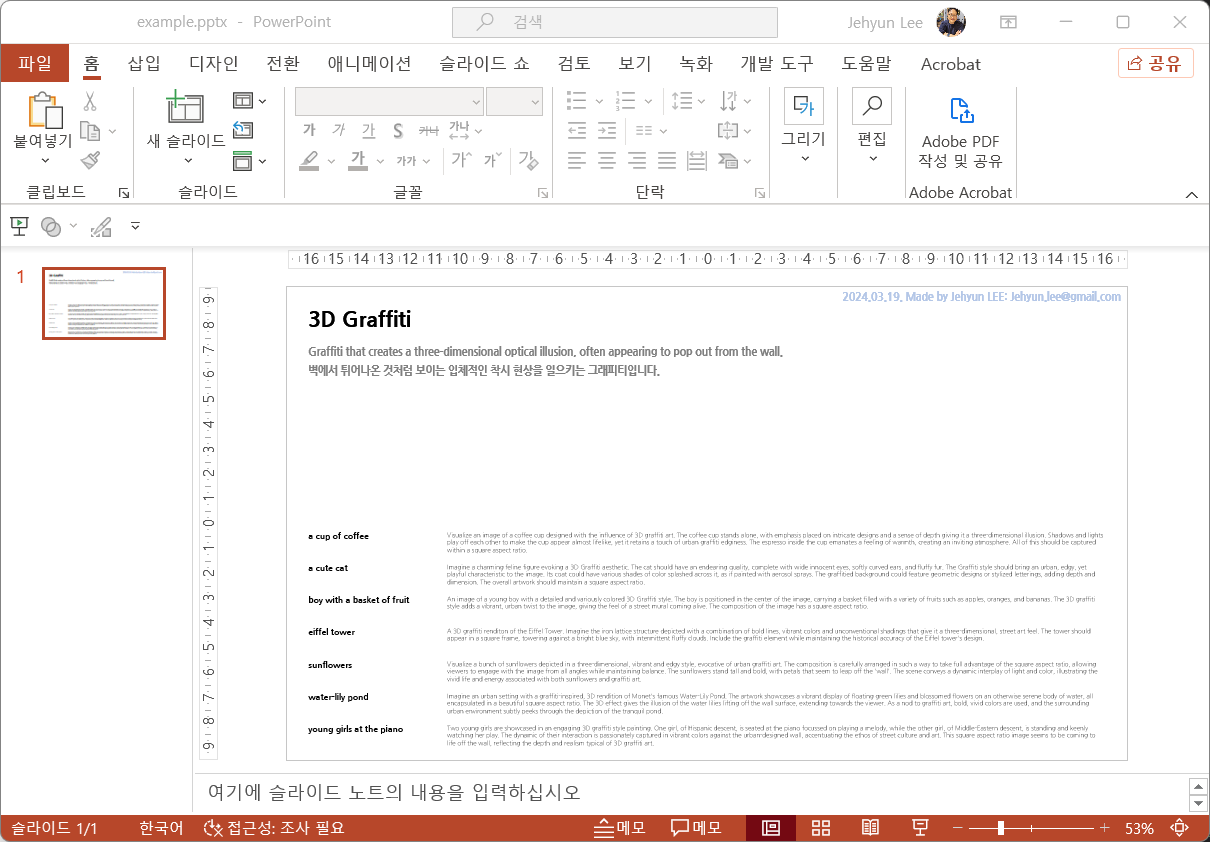
5.4.3. 표 만들기
- object 이름과 revised prompt가 담긴 표를 만들 차례입니다.
- 표는 여러 개의 텍스트 상자가 붙어있다고 볼 수 있으며, row와 column 수, row height와 column width 등 훨씬 많은 속성을 필요로 합니다.
- 색이 여러 곳에 들어가야 하기 때문에 여기서는 background colors와 font colors를 hex code로만 받도록 했습니다.
- 그래도 복잡해져서 column별로 속성을 통일하도록 했는데, 실제 시행 착오를 겪으며 구현에 적지 않은 시간이 걸렸습니다.
1 | from pptx.dml.color import RGBColor |
- 앞에서 만든 슬라이드에 표를 삽입합니다.
- 표에 들어갈 내용은 앞에서 정리한 데이터프레임에서 가져옵니다.
1 | # Table: styles and revised prompts |
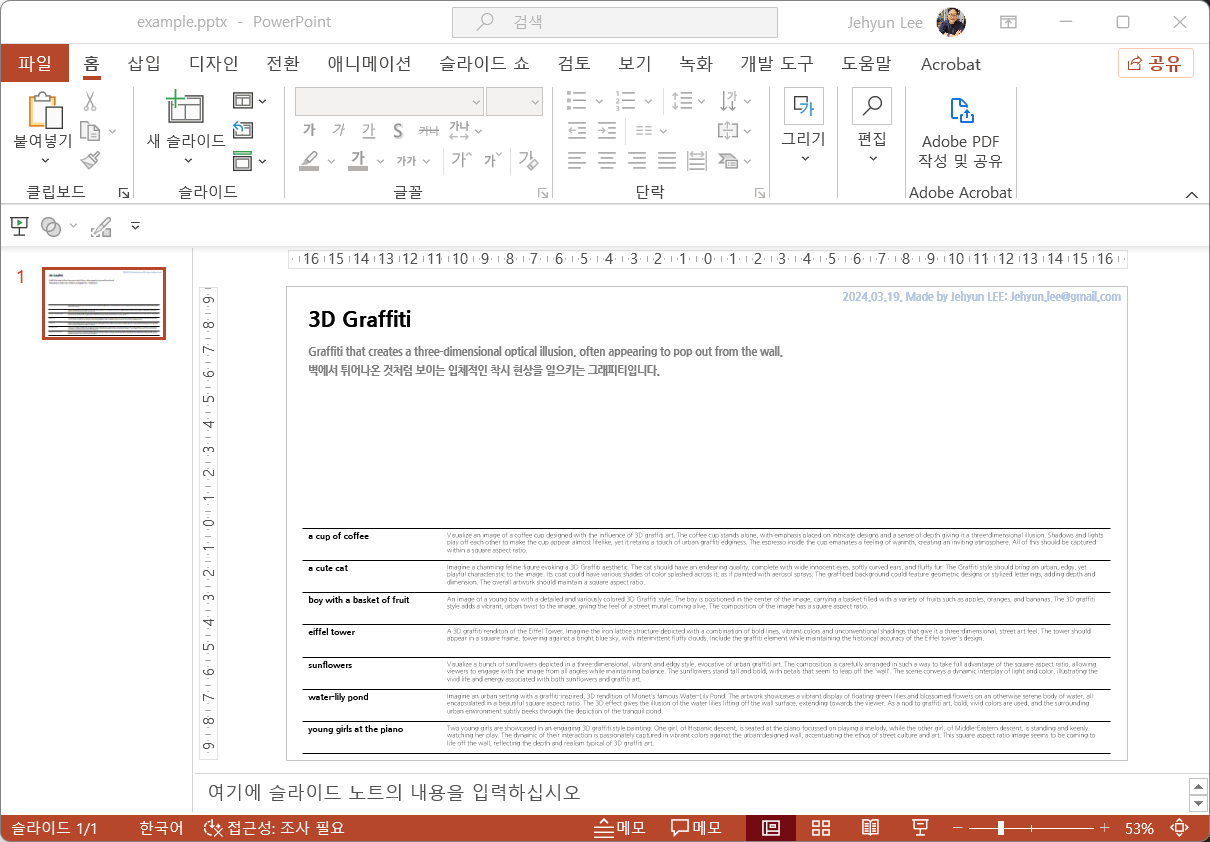
5.4.4. 선 그리기
- python-pptx에 큰 단점이 있습니다.
- 표 경계선(border) 속성 제어가 안된다는 점입니다.
- 번거롭지만 추가로 선을 그려서 object별 revised prompt를 구분합니다.
1 | # Line 삽입 함수 |
- row 수보다 하나 더 많은 선을 추가합니다.
1 | # Line: horizontal lines between rows |
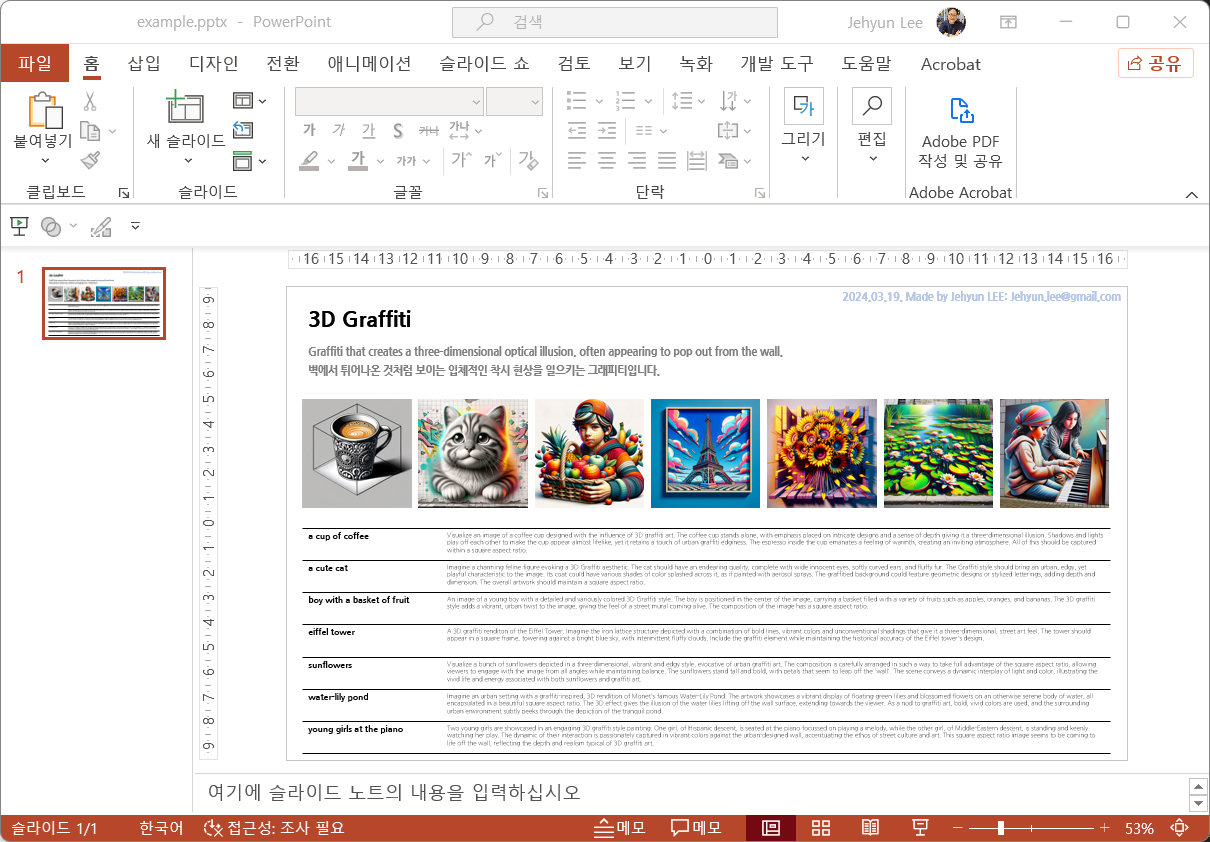
5.4.5. 이미지 삽입
- 마지막으로 이미지를 삽입합니다.
- DALL.E에서 만든 이미지들을 각각의 폴더에 모아두었기에 폴더와 파일명을 정확히 지정해서 불러옵니다.
- 이미지 삽입 명령은 다른 것보다 단순합니다.
1 | # Image 삽입 함수 |
- 같은 방식으로, 이어서 슬라이드에 그림을 붙입니다.
object_us는 object별로 폴더 이름과 파일명 시작을 정해둔 규칙입니다.
1 | # Image: DALL.E3 generated image |
- 약 3초의 시간이 지나고 동작이 완료됩니다.
- 파일을 열어 보면 손으로 한 땀 한 땀 만들었던 슬라이드와 구성이 동일합니다.
- 손으로 만든 슬라이드에서 구성 요소들의 위치와 크기를 충실히 반영한 덕분입니다.
5.4.5. 자동화
- 위 함수들을 사용해 파워포인트 슬라이드 위에 도안대로 객체들을 늘어놓습니다.
- 슬라이드 한 장에 그림이 7장씩 들어가다 보니, 20장만 그려도 용량이 200메가가 넘습니다.
- 우선 개별 파일로 저장하여 PDF 변환 후 합치는 전략을 선택합니다.
1 | # 20개씩 슬라이드 생성 |
6. 마무리
- 마지막으로, 워터마크를 박아넣고 PDF로 변환한 뒤 취합하면 다음과 같은 자료가 됩니다.
- 처음 구상보다 스케일이 많이 커졌습니다.
- 본의 아니게 2700장이 넘는 데이터를 생성한 셈이 되었는데, 이 것으로 무엇을 할지 고민을 해봐야겠습니다. :)
- 다채로운 상상력을 발휘하시는 데 도움이 되기를 바랍니다.
DALL.E3 스타일 가이드북 part I 다운로드
DALL.E3 스타일 가이드북 part II 다운로드
DALL.E3 스타일 가이드북 part III 다운로드
DALL.E3 스타일 가이드북 part IV 다운로드
