- 이미지를 처리하는 파이썬 라이브러리는 많습니다.
- 가장 잘 알려진 opencv와 pillow를 비롯해서 matplotlib도 이미지 처리를 합니다.
- colorsys라는 파이썬 기본 라이브러리가 있습니다.
- 색 공간을 변환하는 라이브러리인데, 이것만 잘 써도 할 수 있는 게 많습니다.
1. 예제 이미지
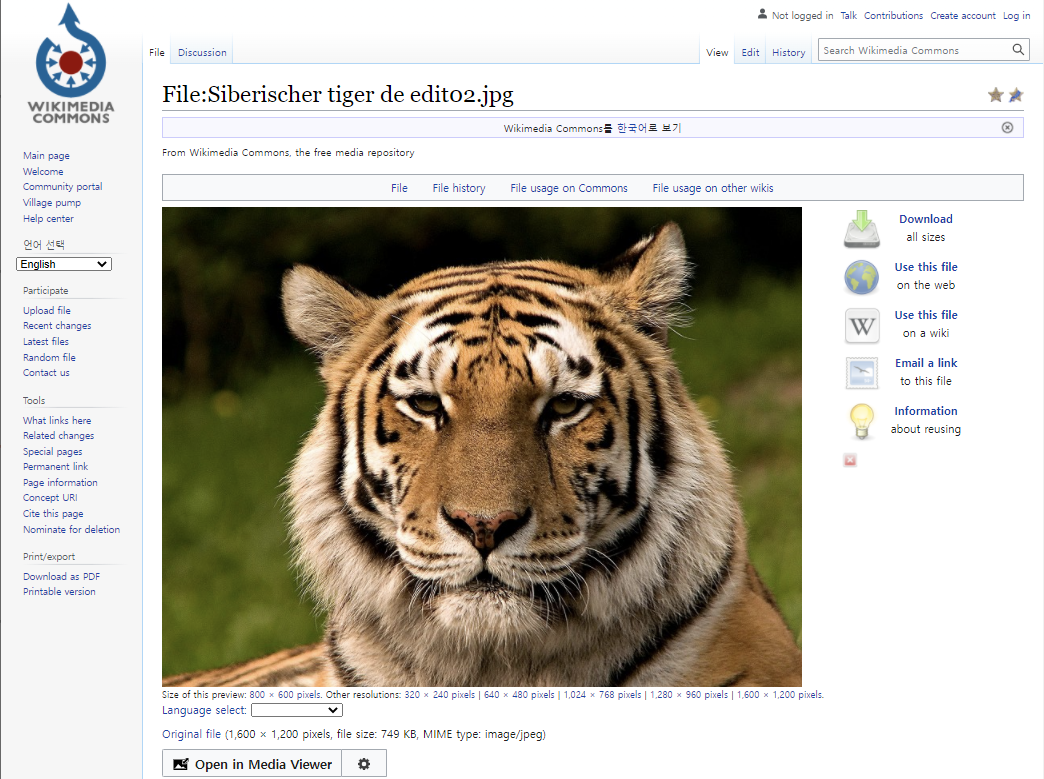
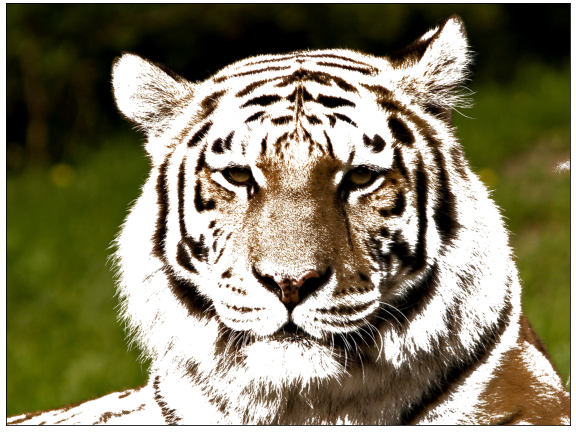
- 예제로 사용할 이미지를 가져옵니다.
- 호랑이 해이니 호랑이 사진을 사용해 보겠습니다.
- 저작권 걱정이 없는 wikimedia에서 사진을 내려받아
tiger.jpg라고 저장합니다.
2. Python에서 읽기
- 먼저 기본 라이브러리를 부르고
1 | %matplotlib inline |
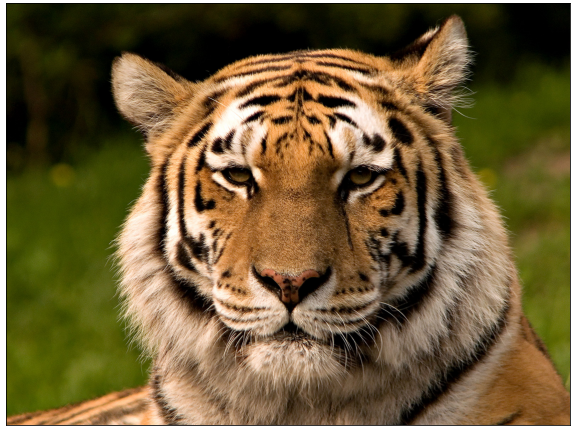
- 이미지를 불러옵니다.
plt.imread()명령으로 읽은 이미지는 numpy array로 저장됩니다..shape으로 dimension을 확인하면 1200 x 1600 x 3입니다.- 세로 1200, 가로 1600의 3차원(RGB) 이미지입니다.
1 | img_org = plt.imread("tiger.jpg") |
- 실행 결과
1 | (1200, 1600, 3) |
3. CIELab color space
- 사람이 인지하는 밝은 정도, 즉 휘도(luminance)를 파악합니다.
- 그림을 구성하는 RGB를 [colorspacious] 라이브러리의
cspace_converter를 사용해 CIELab 색공간으로 변환합니다. - CIELab 색공간의 첫번째 채널이 $L^*$, 즉 휘도입니다.
1 | # convert to CIELab |
- 실행 결과
1 | (1200, 1600, 3) |
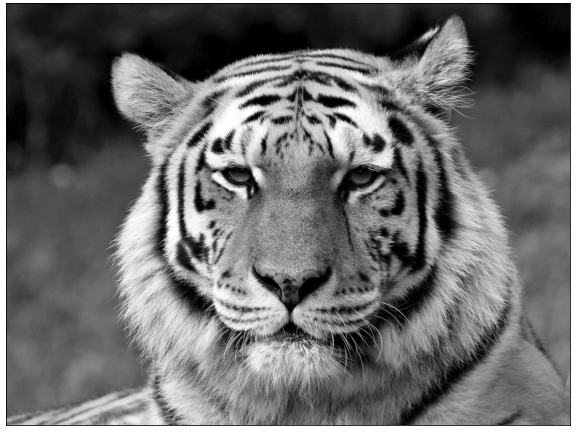
- 흑백 사진으로 변환되었습니다.
- 여기 보이는 회색조가 우리 눈이 느끼는 밝기입니다.
4. HLS color space
-
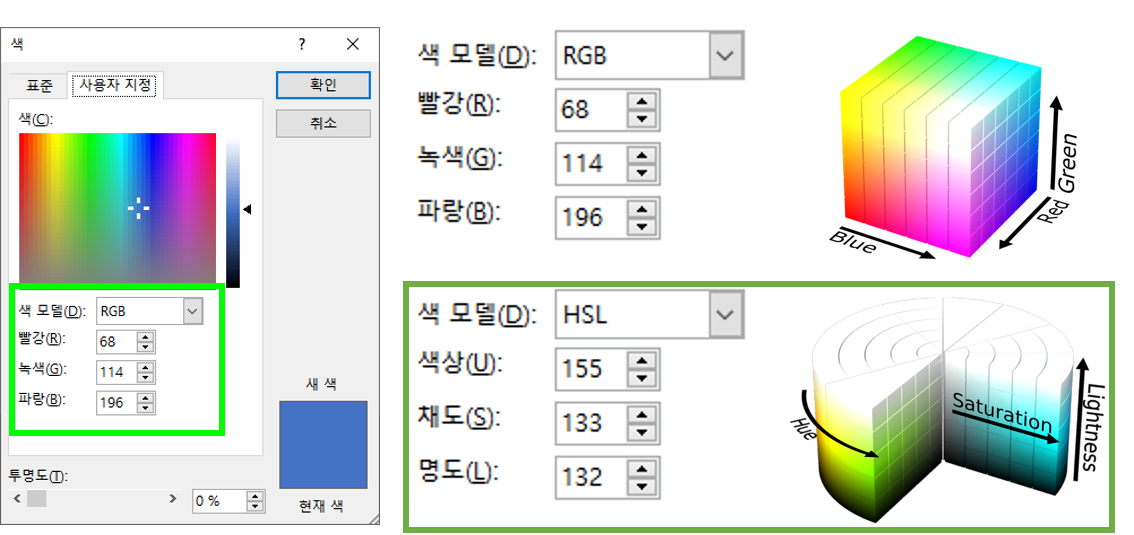
HSV (hue, saturation, value) 색공간과 더불어 HSL, 또는 HLS 색 공간이 사용됩니다.
-
색상(hue)과 명도(lightness), 채도(saturation)를 따로 조정할 수 있다는 장점이 있습니다.
-
python에 기본으로 내장된
colorsys라이브러리는 색 공간 변환에 충실합니다. -
RGB, YIQ, HLS, HSV 공간을 오가는 기능을 간단하게 제공합니다.
-
호랑이 이미지를 HLS 공간으로 바꾸어 hue, lightness, saturation 분포를 확인합니다.
1 | import colorsys |
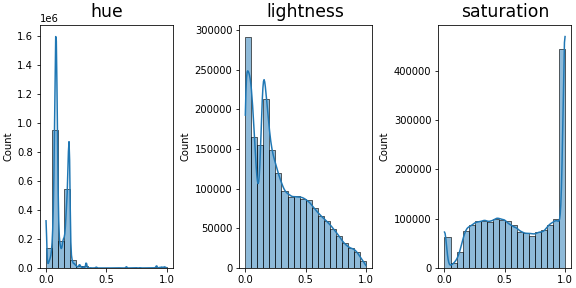
- lightness를 보면 어두운 부분이 많은 것 같고,
- saturation을 보면 원색에 가까운 비중이 상당히 높습니다.
- hue가 좀 독특한데, 왼쪽에 몰려 있습니다.
- 잘못 처리한 것이 아닌지, hue의 숫자가 의미하는 색을 출력합니다.
1 | # hue check |
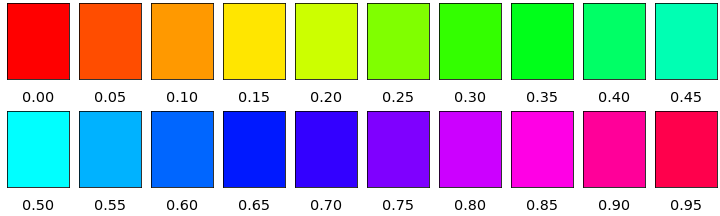
- 히스토그램에서 hue가 몰려 있는 0.25 아래 부분은 빨강, 주황, 노랑, 연두입니다.
- 호랑이와 들판을 이루고 있는 색입니다. 그럴 만 하네요. 정상입니다. :)
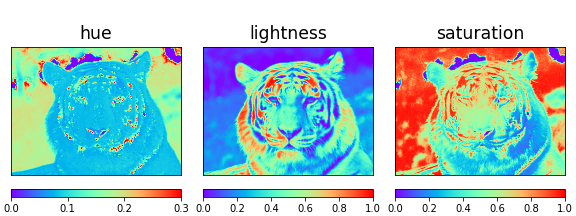
- 호랑이 그림에서 hue, lightness, saturation이 어떻게 분포하고 있는지를 봅니다.
1 | fig, axs = plt.subplots(ncols=3, figsize=(8, 3), constrained_layout=True) |
-
hue만 범위를 0-0.3으로 그리고 나머지는 0-1로 그렸습니다.
-
범위를 쉽게 파악하고자 의도적으로 rainbow colormap을 사용했습니다.
-
배경과 호랑이는 hue와 lightness로 쉽게 구분됩니다.
-
배경 일부에 호랑이와 hue가 같은 구간이 있는데 lightness를 섞으면 같이 구분할 수 있습니다.
-
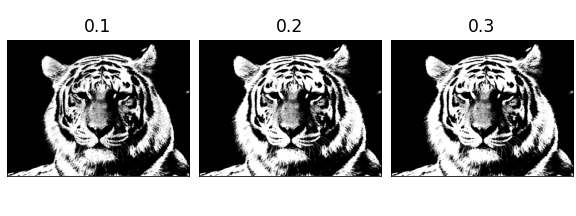
lightness threshold를 0.4로 고정하고
-
hue threshold (
h_th)를 0.1~0.3으로 바꾸면서 호랑이 선택 범위를 확인합니다.
1 | # tiger selection |
-
다른 데는 비슷한데 호랑이 이마와 왼쪽 뺨에서 차이가 보입니다.
-
0.3으로 올리면 얼굴은 검은 줄무늬를 제외하고 거의 선택이 되고 배경으로 넘어가지 않네요.
-
hue threshold를 0.3으로 설정합니다.
-
1600 x 1200개의 픽셀 중 hue는 0.3 미만, lightness는 0.4 초과하는 범위를 잡습니다.
-
호랑이 얼굴의 명도는 올리고 채도는 낮춰서 하얀 장로 호랑이 느낌이 들도록 바꿉니다.
-
~사실 올해가 검은 호랑이 해라 검게 하고 싶었는데 어떻게 해도 안예쁘더군요.~
1 | idx_tiger = np.where((img_hls[0] < 0.3) & (img_hls[1] > 0.4))[0] |
- 호랑이 해 모두 새해 복 많이 받으시기 바랍니다.
