pysolar

  • 태양 위치 계산은 성가십니다.
  • 날짜별, 시간별, 위치별 태양의 위치를 알고싶다면 pysolar가 편리합니다.

pysolar pypi
pysolar github
pysolar documentation

1. pysolar 설치

  • pip로 간단하게 설치할 수 있습니다.
    1
    pip install pysolar

2. pysolar 사용

  • pysolar를 사용하려면 import를 해야 합니다.
  • pysolar를 import 하고 모듈을 확인해보면 뭔가 많습니다.
  • 그런데 공식문서에 설명이 잘 나와 있지 않아 아쉽습니다.

  • 일시와 위치를 넣어주면 태양에 대한 정보를 알려줍니다.
  • 일시는 datetime을 이용해 설정합니다.
    1
    2
    3
    4
    5
    import datetime

    KST = datetime.timezone(datetime.timedelta(hours=9))
    date = datetime.datetime(2017, 3, 21, 13, 0, 0, tzinfo=KST)
    date
    실행결과:
    1
    datetime.datetime(2017, 3, 21, 13, 0, tzinfo=datetime.timezone(datetime.timedelta(seconds=32400)))
  • 그리고 태양을 관찰할 지점을 지정합니다.
    1
    2
    3
    # Daejeon
    lat = 36.3504
    lon = 127.3845

2.1. 고도altitude

  • 지표면으로부터의 각도입니다.
  • .get_altitude()를 사용합니다.
    1
    2
    3
    4
    from pysolar.solar import get_altitude

    alt = get_altitude(lat, lon, date)
    alt
    실행결과: 출력 단위는 degree 입니다.
    1
    53.57702210048166

2.2. 방위각azimuthal angle

  • 정북 기준 시계방향 각도입니다.
  • .get_azimuth()를 사용합니다.
    1
    2
    3
    4
    from pysolar.solar import get_azimuth

    azi = get_azimuth(lat, lon, date)
    azi
    실행결과: 출력 단위는 degree 입니다.
    1
    189.44917229657798

2.3. 일사량radiation

pysolar get_radiation_direct()

  • pysolar가 제공하는 일사량에는 대기에 의한 산란이 포함되어 있습니다.
  • 이 때 대기모델은 미국 기준이기 때문에 데이터 활용에 주의해야 합니다.
    1
    2
    3
    4
    from pysolar.radiation import get_radiation_direct

    rad = get_radiation_direct(date, alt)
    rad
    실행결과: 단위는 $W/m^2$ 입니다.
    1
    961.3376847317991
  • 다음과 같은 수식으로 구성되어 있습니다.
  • 일사량 $$\textrm{direct radiation} = flux \times exp(-1 \times od \times amr) \times daytime$$
    • $$day$$ : datetime.utctimetuple().tm_yday
    • $$daytime$$ : 1 if altitude > 0 else 0
    • apparent extraterrestrial flux : $$flux = 1160+(75\sin( \frac{2 \pi}{365}(day-275)))$$
    • optical depth : $$od = 0.174+(0.035\sin(\frac{2 \pi}{365}(day-100))$$
    • air mass ratio : $$amr = 1/\sin(altitude)$$

2.4. 시각화

  • 2017년 춘분 다른 위도의 일주운동을 그려봅니다.
    1. 방위각 vs 고도
    2. 시간 vs 고도
    3. 시간 vs 일사량 (pysolar 제공)
    4. 시간 vs 사상 (projection)
  • 극좌표와 직교좌표계를 동시에를 담습니다.
    1
    2
    3
    4
    5
    6
    7
    8
    9
    10
    11
    12
    13
    14
    15
    16
    17
    18
    19
    20
    21
    22
    23
    24
    25
    26
    27
    28
    29
    30
    31
    32
    33
    34
    35
    36
    37
    38
    39
    40
    41
    42
    43
    44
    45
    46
    47
    48
    49
    50
    51
    52
    53
    54
    55
    56
    57
    58
    59
    60
    61
    62
    63
    64
    65
    66
    67
    68
    69
    70
    71
    72
    73
    74
    75
    76
    77
    78
    79
    80
    81
    82
    83
    84
    85
    86
    87
    88
    89
    90
    91
    92
    93
    94
    95
    96
    97
    98
    99
    100
    101
    102
    103
    104
    105
    106
    107
    108
    109
    110
    111
    112
    113
    114
    115
    116
    117
    118
    119
    120
    121
    122
    123
    124
    125
    126
    127
    128
    129
    130
    131
    132
    133
    134
    135
    136
    137
    import matplotlib.pyplot as plt
    import seaborn as sns
    from matplotlib.ticker import MultipleLocator, AutoMinorLocator

    lats = [45, 23.5, 1, -23.5, -45]
    lon = 127.3845

    ### data
    nlats = len(lats)
    alts_lat = {}
    azis_lat = {}
    date_hr_lat = {}

    ### altitudes and azimuthal angles
    for i, lat in enumerate(lats, 1):
    alts, azis, dates_hr = [], [], []
    for hr in range(24):
    for min in range(0, 60, 1):
    date_hr = datetime.datetime(2017, 3, 20, hr, min, 0, tzinfo=KST)
    dates_hr.append(date_hr)
    alt = get_altitude(lat, lon, date_hr)
    azi = get_azimuth(lat, lon, date_hr)
    alts.append(alt)
    azis.append(azi)

    date_hr_lat[i] = dates_hr
    alts = np.array(alts)
    alts_lat[i] = alts
    azis = np.array(azis)
    azis_lat[i] = azis


    ### Figure
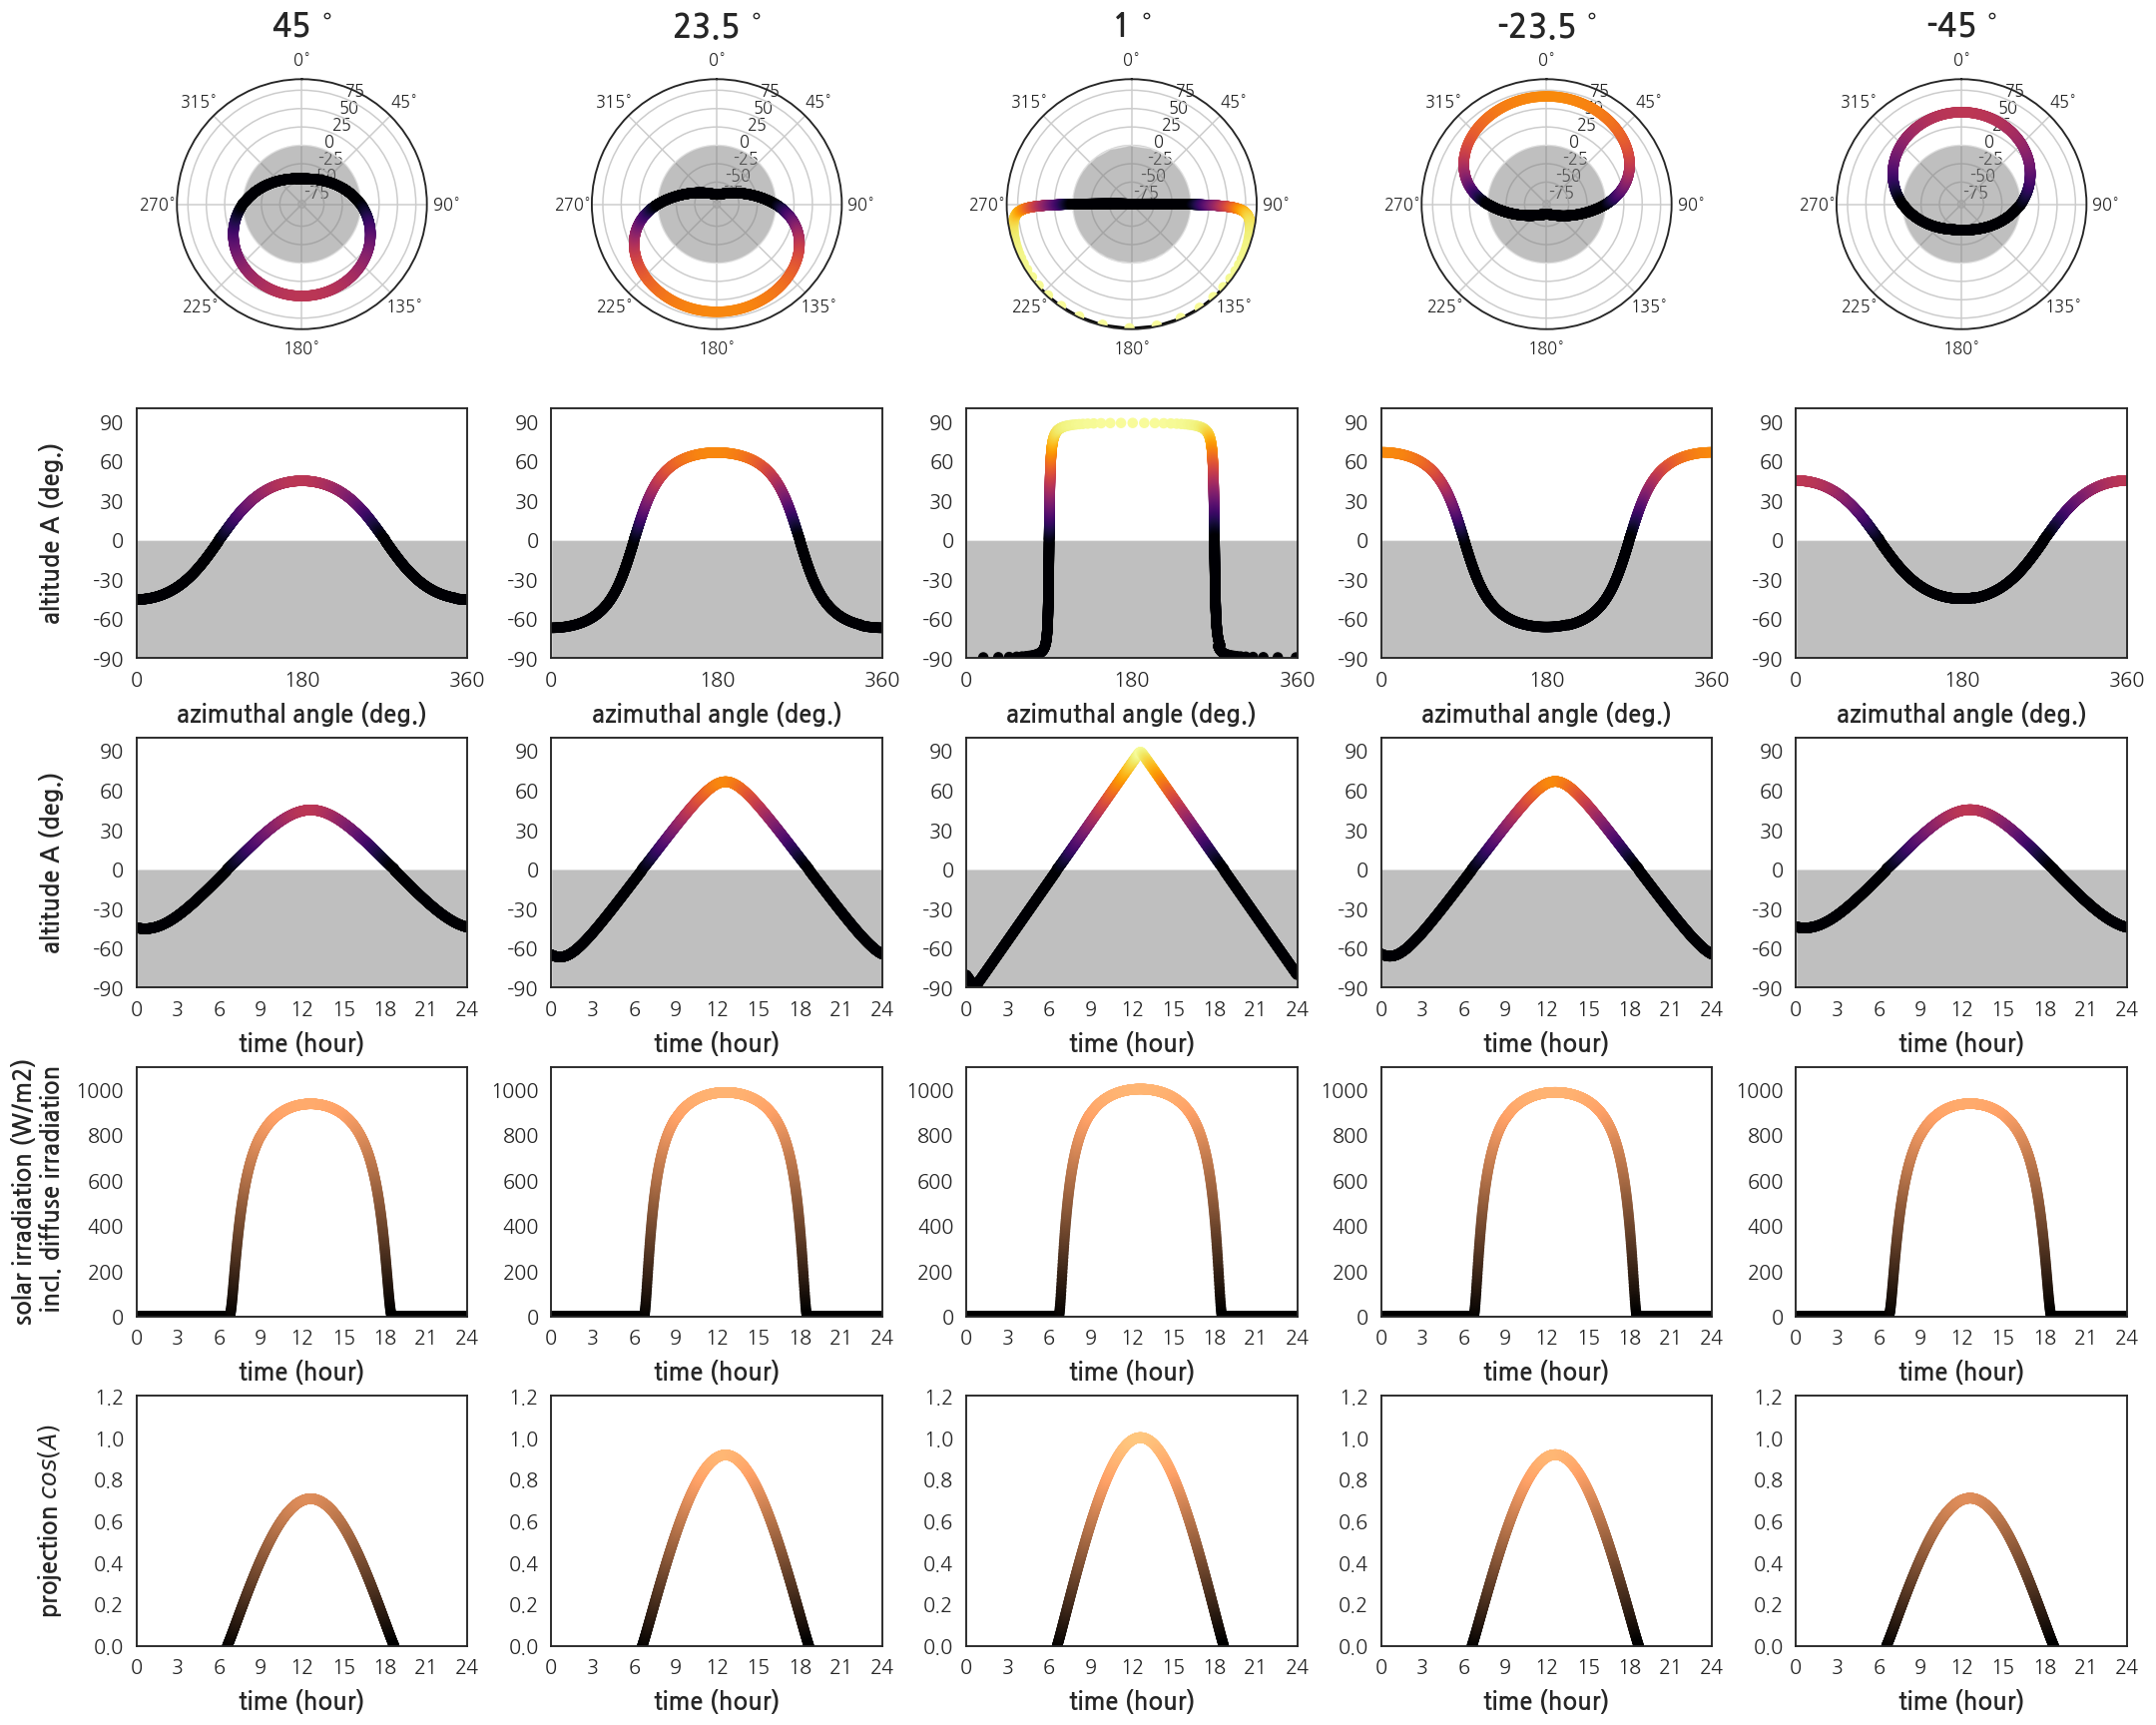
    fig = plt.figure(figsize=(30,24))
    axs = {}

    for i, (lat) in enumerate(lats, 1):
    axs[i] = fig.add_subplot(5, nlats, i, projection='polar')

    axs[i].set_theta_zero_location("N")
    axs[i].set_theta_direction(-1)

    axs[i].plot(np.deg2rad(azis_lat[i]), alts_lat[i], c="k", zorder=1)
    axs[i].scatter(np.deg2rad(azis_lat[i]), alts_lat[i], c=alts_lat[i],
    cmap="inferno", zorder=2, vmin=0, vmax=90)

    axs[i].fill(np.deg2rad(azis_lat[i]), [0]*len(azis_lat[i]), "gray", alpha=0.5)
    axs[i].set_ylim(-80, 90)
    axs[i].set_title(f"{lat}" + " $^{\circ}$", fontdict={"fontsize":32, "fontweight":"bold"}, pad=16)

    # azimuth vs altitude
    hrs = list(range(1440))
    for i, (lat) in enumerate(lats, nlats+1):
    axs[i] = fig.add_subplot(5, nlats, i)
    axs[i].scatter(azis_lat[i-nlats], alts_lat[i-nlats], c=alts_lat[i-nlats],
    cmap="inferno", zorder=2, vmin=0, vmax=90)

    axs[i].xaxis.set_major_locator(MultipleLocator(180))
    axs[i].xaxis.set_minor_locator(MultipleLocator(60))

    axs[i].set_xlim(0, 360)
    axs[i].set_ylim(-90, 100)
    yticks = [-90, -60, -30, 0, 30, 60, 90]
    axs[i].set_yticks(yticks)
    axs[i].set_yticklabels(yticks)
    axs[i].tick_params(axis="both", labelsize=20)
    axs[i].fill_between(hrs, -90, 0, facecolor="gray", alpha=0.5)
    axs[i].set_xlabel("azimuthal angle (deg.)", fontdict={"fontsize":24, "fontweight":"bold"}, labelpad=12)
    if i == nlats+1:
    axs[i].set_ylabel("altitude A (deg.)", fontdict={"fontsize":24, "fontweight":"bold"}, labelpad=12)

    # time vs altitude
    hrs = list(range(1440))
    for i, (lat) in enumerate(lats, 2*nlats+1):
    axs[i] = fig.add_subplot(5, nlats, i)
    axs[i].scatter(hrs, alts_lat[i-2*nlats], c=alts_lat[i-2*nlats],
    cmap="inferno", zorder=2, vmin=0, vmax=90)

    axs[i].xaxis.set_major_locator(MultipleLocator(180))
    axs[i].xaxis.set_minor_locator(MultipleLocator(60))

    axs[i].set_xlim(0, 1440)
    axs[i].set_ylim(-90, 100)
    xticks = [int(x//60) for x in axs[i].get_xticks()]
    axs[i].set_xticklabels(xticks)
    axs[i].set_xlabel("time (hour)", fontdict={"fontsize":24, "fontweight":"bold"}, labelpad=12)
    yticks = [-90, -60, -30, 0, 30, 60, 90]
    axs[i].set_yticks(yticks)
    axs[i].set_yticklabels(yticks)
    axs[i].tick_params(axis="both", labelsize=20)
    axs[i].fill_between(hrs, -90, 0, facecolor="gray", alpha=0.5)
    if i == 2*nlats+1:
    axs[i].set_ylabel("altitude A (deg.)", fontdict={"fontsize":24, "fontweight":"bold"}, labelpad=12)

    # irradiation accounting for the scattering of light (by US atmosphere model)
    for i, lat in enumerate(lats, 3*nlats+1):
    axs[i] = fig.add_subplot(5, nlats, i)

    # irradiation by pysolar
    irrs_pysolar = []
    for j in range(len(date_hr_lat[i-(3*nlats)])):
    irr_pysolar = get_radiation_direct(date_hr_lat[i-(3*nlats)][j],
    alts_lat[i-(3*nlats)][j])
    irrs_pysolar.append(irr_pysolar)

    axs[i].scatter(hrs, irrs_pysolar, c=irrs_pysolar,
    cmap="copper", zorder=2, vmin=0, vmax=1100)
    axs[i].xaxis.set_major_locator(MultipleLocator(180))
    axs[i].xaxis.set_minor_locator(MultipleLocator(60))
    axs[i].set_xlim(0, 1440)
    xticks = [int(x//60) for x in axs[i].get_xticks()]
    axs[i].set_xticklabels(xticks)
    axs[i].set_xlabel("time (hour)", fontdict={"fontsize":24, "fontweight":"bold"}, labelpad=12)
    axs[i].tick_params(axis="both", labelsize=20)
    axs[i].set_ylim(0, 1100)
    if i == 3*nlats+1:
    axs[i].set_ylabel("solar irradiation (W/m2)\n incl. diffuse irradiation", fontdict={"fontsize":24, "fontweight":"bold"}, labelpad=12)

    # direct irradiation, above the atmosphere
    for i, lat in enumerate(lats, 4*nlats+1):
    axs[i] = fig.add_subplot(5, nlats, i)
    irradiation = np.sin(np.deg2rad(alts_lat[i-(4*nlats)]))
    axs[i].scatter(hrs, irradiation, c=irradiation,
    cmap="copper", zorder=2, vmin=0, vmax=1)
    axs[i].xaxis.set_major_locator(MultipleLocator(180))
    axs[i].xaxis.set_minor_locator(MultipleLocator(60))
    axs[i].set_xlim(0, 1440)
    xticks = [int(x//60) for x in axs[i].get_xticks()]
    axs[i].set_xticklabels(xticks)
    axs[i].set_xlabel("time (hour)", fontdict={"fontsize":24, "fontweight":"bold"}, labelpad=12)
    axs[i].tick_params(axis="both", labelsize=20)
    axs[i].set_ylim(0, 1.2)
    if i == 4*nlats+1:
    axs[i].set_ylabel("projection " + "$cos(A)$", fontdict={"fontsize":24, "fontweight":"bold"}, labelpad=12)

    fig.align_ylabels([axs[1], axs[6], axs[11], axs[16], axs[21]])
    fig.tight_layout()
    위도에 따라 태양의 움직임이 다릅니다.
  • 일주운동의 연중 변화를 살펴봅니다.
  • 지역은 대전으로 고정하고 날짜만 춘분, 하지, 추분, 동지로 나눕니다.
    1. 방위각 vs 고도
    2. 시간 vs 높이가 1인 막대기의 그림자 끝 위치
  • 시각화 코드입니다.
    1
    2
    3
    4
    5
    6
    7
    8
    9
    10
    11
    12
    13
    14
    15
    16
    17
    18
    19
    20
    21
    22
    23
    24
    25
    26
    27
    28
    29
    30
    31
    32
    33
    34
    35
    36
    37
    38
    39
    40
    41
    42
    43
    44
    45
    46
    47
    48
    49
    50
    51
    52
    53
    54
    55
    56
    57
    58
    59
    60
    61
    62
    63
    64
    65
    66
    67
    68
    69
    70
    71
    72
    73
    74
    # Daejeon
    lat = 36.3504
    lon = 127.3845

    # dates
    months = [3, 6, 9, 12]
    dates = [21, 21, 23, 22]
    colors = ["red", "green", "blue", "purple"]
    markers = ["x", "^", "s", "o"]

    alts, azis = {}, {}
    for month, date in zip(months, dates):
    alts[month], azis[month] = [], []
    for hr in range(24):
    for minu in range(0, 60, 30):
    date_hr = datetime.datetime(2017, month, date, hr, minu, 0, tzinfo=KST)
    alt = get_altitude(lat, lon, date_hr)
    azi = get_azimuth(lat, lon, date_hr)
    alts[month].append(alt)
    azis[month].append(azi)

    alts[month] = np.array(alts[month])
    azis[month] = np.array(azis[month])


    ### visualziation
    fig = plt.figure(figsize=(12,6))

    # diurnal motion
    ax1 = fig.add_subplot(1, 2, 1, projection='polar')
    ax1.set_theta_zero_location("N")
    ax1.set_theta_direction(-1)
    ax1.fill(np.deg2rad(azis[3]), [0]*len(azis[3]), "gray", alpha=0.5)

    for month, marker, color in zip(months, markers, colors):
    ax1.plot(np.deg2rad(azis[month]), alts[month], c=color, zorder=1)
    im1 = ax1.scatter(np.deg2rad(azis[month]), alts[month], marker=marker,
    c=alts[month], ec=color, lw=1, cmap="inferno",
    vmin=0, vmax=90, zorder=2)

    cbar1 = plt.colorbar(im1, ax=ax1, fraction=0.046, pad=0.15, ticks= [0, 30, 60, 90])
    cbar1.set_label("altitude (deg.)", fontsize=20, labelpad=12)

    ax1.set_title("diurnal motion", fontdict={"fontsize":20, "color":"gray", "fontweight":"bold"}, pad=12)

    # shadow
    ax2 = fig.add_subplot(1, 2, 2, projection='polar')
    ax2.set_theta_zero_location("N")
    ax2.set_theta_direction(-1)
    # cmaps = ["Reds_r", "Greens_r", "Blues_r", "Purples_r"]
    time_arr = np.linspace(0, 47, 48)/2
    handles = []

    for month, color, marker in zip(months, colors, markers):
    shadow_idx = np.where(alts[month]>0)[0]
    shadow_azis_rad = np.deg2rad(azis[month][shadow_idx]+180)
    shadow_lengths = 1/np.tan(np.deg2rad(alts[month][shadow_idx]))
    ax2.plot(shadow_azis_rad, shadow_lengths, c=color, zorder=1)
    im2 = ax2.scatter(shadow_azis_rad, shadow_lengths, marker=marker,
    c=time_arr[shadow_idx], ec=color, lw=1, cmap="gist_gray",
    vmin=0, vmax=23.5, zorder=2)
    handles.append(im2)

    ax2.set_ylim(0, 3)
    ax2.yaxis.set_major_locator(MultipleLocator(1))

    cbar2 = plt.colorbar(im2, ax=ax2, fraction=0.046, pad=0.15, ticks= list(range(28, 4)))
    cbar2.set_label("time (hour)", fontsize=20, labelpad=12)

    ax2.set_title("shadow motion", fontdict={"fontsize":20, "color":"gray", "fontweight":"bold"}, pad=12)

    fig.legend(handles=handles, labels=["spring equinox", "summer soliste", "autumn equinox", "winter soliste"],
    ncol=4, bbox_to_anchor=(0., 0.9, 1., .1), mode="expand")
    fig.tight_layout(rect=[0,0,1,0.9])
    계절에 따라 하루 중 태양과 그림자의 움직임이 다릅니다.


도움이 되셨나요? 카페인을 투입하시면 다음 포스팅으로 변환됩니다

Share