- csv 파일에서 읽은 기본 정보를 바탕으로 polygon shapefile을 생성하는 과정입니다.
shapely와fiona를 사용했으며,geopandas 0.8을 설치할 때 함께 설치되는 버전을 사용했습니다.shapely버전은 1.7,fiona버전은 1.8.13.post1 입니다.
References
1. csv 읽기
.csv파일에서 건물 정보를 읽어옵니다.
1 | df_ombb0914 = pd.read_csv('./data/ombb_200914.csv') |
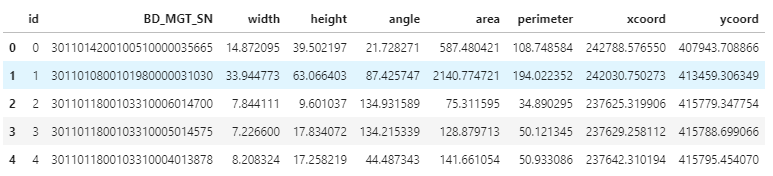
- 데이터 컬럼은 다음과 같습니다.
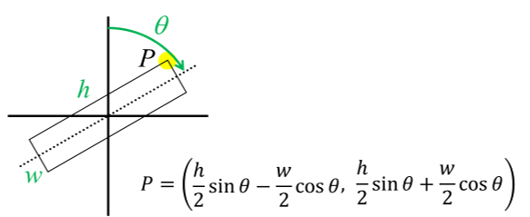
BD_MGT_SN: 건물관리번호 (건물 고유 번호)width$$w$$ : 최소경계도형 폭 ($$m$$)height$$h$$ : 최소경계도형 높이 ($$m$$)angle$$\theta$$ : 최소경계도형 회전각. 정북 기준 시계방향 ($$\text{deg.}$$)area: 최소경계도형 넓이 ($$m^2$$)perimeter: 최소경계도형 둘레 ($$m$$)xcoord: 최소경계도형 중심점 x좌표 (ESPG:5186)ycoord: 최소경계도형 중심점 y좌표 (ESPG:5186)
2. polygon 변환
- 행 하나가 건물 하나에 해당합니다.
- 행 하나마다 정보를 좌표로 변환해서
shapefile로 저장합니다.
1 | from shapely.geometry import mapping, Polygon |
3. QGIS에서 확인
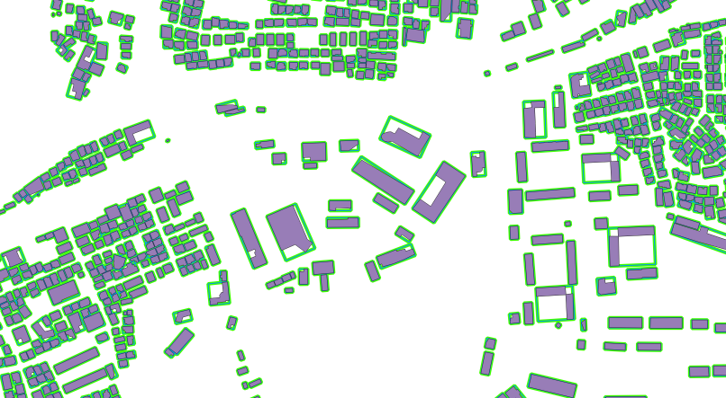
- QGIS에서 읽어서 잘 보이는지 확인합니다.
- .csv를 출력한 원본(노랑)과 생성된 shapefile(파랑) 비교 결과 완벽히 일치합니다.
- 최소경계도형(보라)과 비교해봐도 잘 복원되었습니다.