Signal Envelope
- 복잡한 신호의 전반적인 형상을 파악하기 위해 envelope을 추출합니다.
- python에서는
scipy.signal.hilbert를 통해 analytic signal을 추출하는 방법을 씁니다.
1 | x = np.arange(0, 20.1, 0.1) |
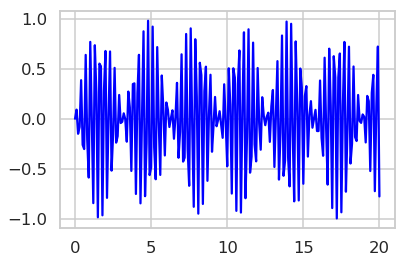
- 이와 같은 신호에
hilbert를 다음과 같이 적용하면 다음과 같이 숨겨진 sine wave를 찾아냅니다.
1 | from scipy.signal import hilbert, chirp |
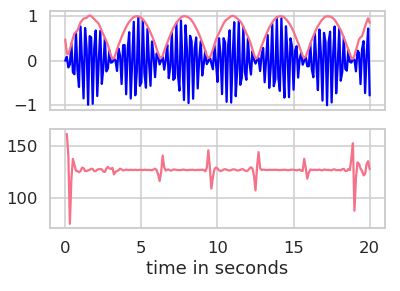
- 그러나, 위 신호 그대로의 모습을 추출하려면 이론식을 찾는
hilbert는 답답한 면이 있습니다. - 그럴 때는 아래와 같이 그래프의 요철을 감지해서
interpolation하는 방법이 직관적입니다.
1 | def get_envelope_v1(x, y): |
1 | uy, ly = get_envelope_v1(x, y) |
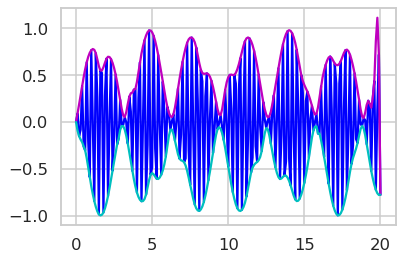
- signal envelope은 보통 전체적인 형상을 추출하는데 사용되지만, smoothing 제어에 사용될 수도 있습니다.
Least Squares Smoothing
scipy.signal.savgol_filter
Least Squares Filtering and Smoothing, including Savitzky-Golay
Plateau Detection
-
신호와 함께 존재하기 마련인 잡음을 제거하기 위해 smoothing을 적용합니다.
-
savinsky-golay filter와 같은 least squares filter는 mean이나 median에 비해 신호를 보존하고 잡음을 선택적으로 잘 제거한다는 장점이 있습니다. -
그러나 치명적인 단점이 있는데, signal이 크게 바뀔 경우 overshooting이 발생한다는 것입니다.
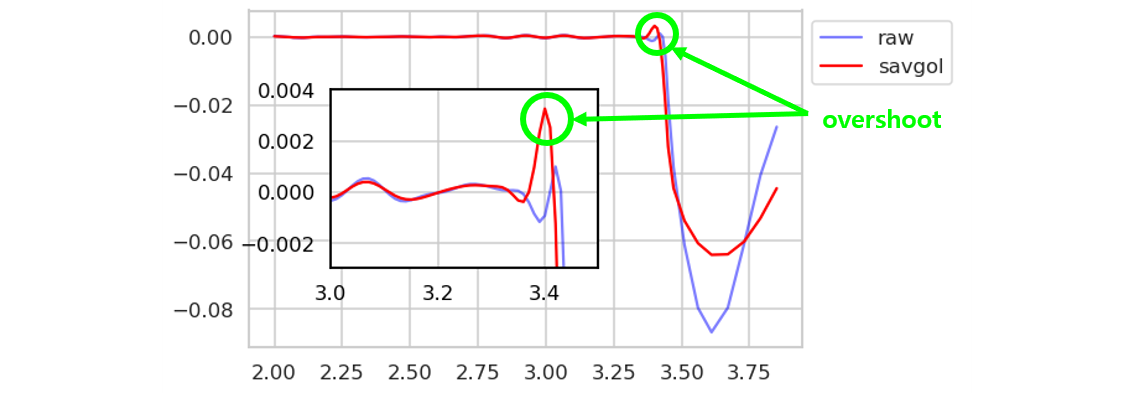
-
envelope을 이용해 overshooting의 범위를 제한해 보겠습니다.
-
그러나 데이터가 이렇게 생기면 envelope도 깔끔하진 않습니다.
-
같은 코드를 적용해도, 아래와 같이 envelope의 undershooting이 커서 문제가 됩니다.
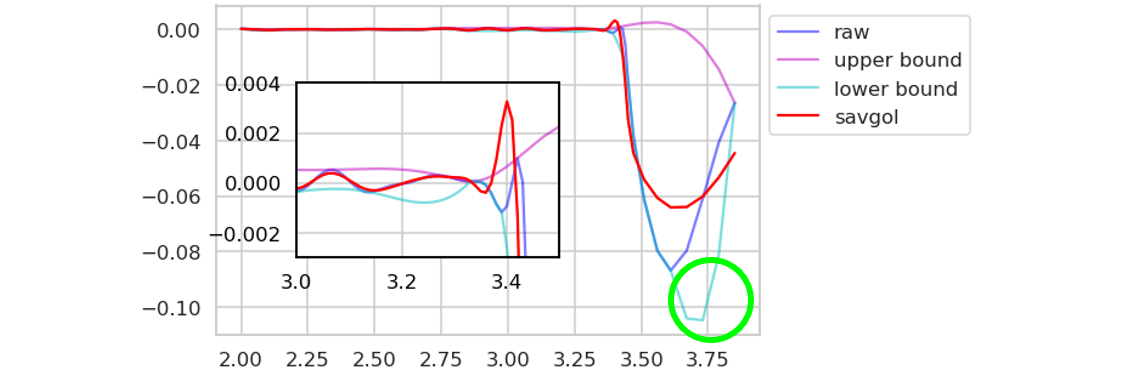
-
envelop과 원래 데이터를 다시 비교해서 envelope의 범위를 제어합니다.
-
위
get_envelope()에 아래 부분을 추가합니다.
1 | # upper through check |
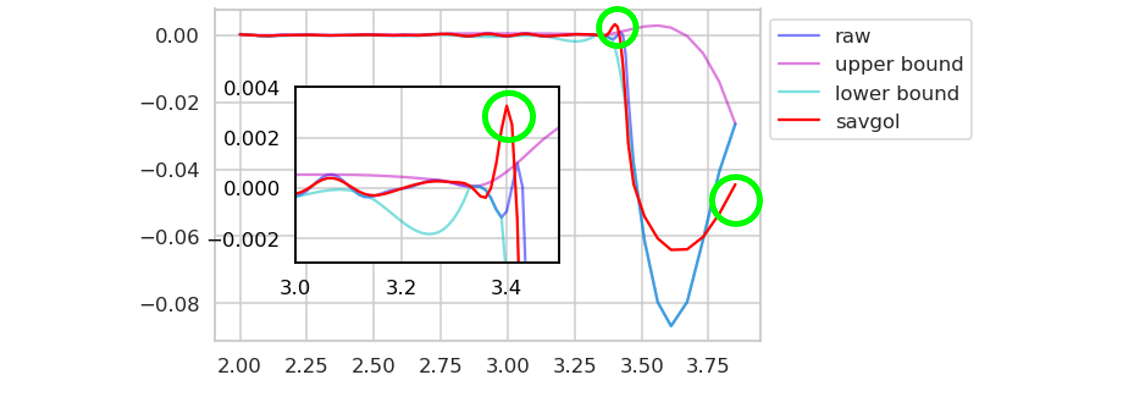
- envelope의 범위가 제어되었습니다.
- 이제 envelope을 벗어난 signal 대신 envelope을 적용합니다.
1 | def savgol(x, y, box_size, recur=1): |
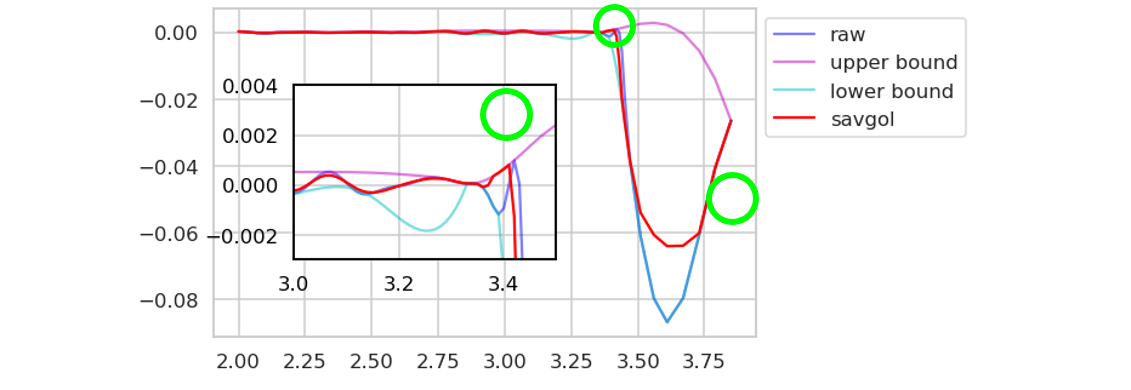
- Savgol filter의 overshooting 문제가 해결되었습니다.
- 강제로 집어넣은 부분이 다른 부분에 비해 다소 날카롭습니다.
- 그러나 overshooting에 비해서는 완화된 것을 확인할 수 있습니다.
- 전체 코드는 여기에서 확인 가능합니다.
